Google Analytics has a wealth of data and can be used for much more than just measuring traffic increases and decreases. It has numerous reports that are useful for any kind of business that has a website. However, it also has some reports that can be very helpful for e-commerce businesses.
E-commerce business marketers don’t need to be an expert in using Google Analytics to be able to benefit from it. Google Analytics has been designed to make it simple to start benefiting from it. It also has some more advanced features for those who have grasped the basics.
In this article, I will run through five Google Analytics reports that are beneficial for eCommerce businesses. I will explain what data the reports show, where to find them and how you can start benefiting from them. Below are the five Google Analytics reports for e-commerce businesses that I will be discussing:
1 – Age and Gender
2 – Location
3 – Search Terms
4 – Product Performance
5 – Page Timings
1. Age and Gender
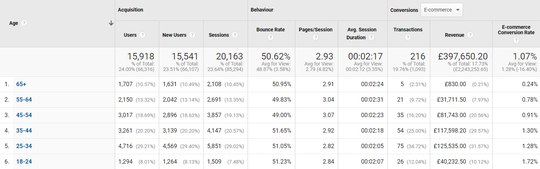
The Age and Gender reports show how people interacted with your site based on their age group or gender. To determine this information, Google looks at the gender and age the user gave when they signed up to their Gmail account.
The Age report is segmented into six age groups:
18 – 24
25 – 34
35 – 44
45 – 54
55 – 65
65+
Where to find the report: Audience > Demographics > Age or Gender
Example uses of the report
Find out what age group or gender is your main customer
Understanding the demographics of your customer can be useful when deciding on what kind of marketing activities you should be carrying out and what type of content you should include. The Age and Gender reports within Google Analytics can help with this. Look at the Users column to determine which age category or gender mostly visits your website.
If you’re carrying out a marketing campaign such as a brand awareness campaign and want to attract the most people as possible, then you could look at tailoring your marketing campaign to the age groups and gender that visit your site the most.
Find out which age group or gender has the highest and lowest AOV
I often have discussions with e-commerce businesses that want to increase their average order value. Looking at the average order value of each demographic is a good starting point to diagnose where the issues are and where you need to focus your efforts. If you know which demographic has the lowest average order value, then you can start looking at specific marketing campaigns tailored towards increasing the average order value of those demographics. You can work out your average order value by dividing the Revenue column with the Transactions column
Find out which age group or gender has the highest conversion rate
Knowing which demographic has the highest conversion rate can be beneficial when you need to decide on what demographics to target on your Google Ads PPC campaign. If any demographics have a very poor conversion rate, then you may choose not to target these demographics on your Google Ads PPC campaign. If there is a demographic that converts quite well, but the conversion rate is still lower than average, then you could decide to apply a bid reduction on that demographic. Similarly, for demographics that have a conversion rate that is much better than average, you can apply a bid increase to bring in more of that kind of traffic.
While you do have demographic performance data in Google Ads, Google Analytics has data on all of your website and not just on Google Ads demographic data. This can be useful if you have a small budget on Google Ads and have not built up enough demographic data just yet within Google Ads. Looking at Google Analytics, demographic data can also be useful if you haven’t yet run a Google Ads PPC campaign and want to get an idea on your demographic performance.
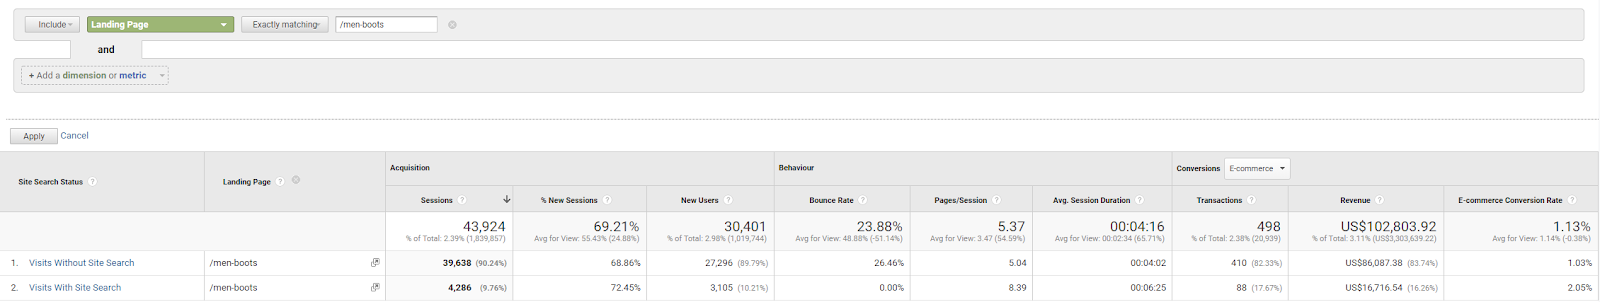
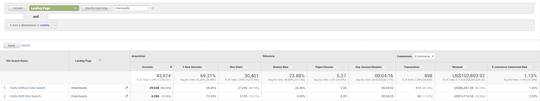
If you need to see demographic performance based on a specific set of products, then you can add in a landing page as a secondary dimension and use the Advanced filter to only show data where the landing page contains a specific word or set of words.
Determine what age groups and genders perform well on a particular product
When choosing your marketing assets for a particular product or set of products, it can be useful to see what demographics the product appeals to. You can find this out by adding in the landing page as a secondary dimension and then using the advanced filter to only show data for product pages that you require. Once you have this data, look at which demographic has the highest amount of Transactions and Revenue. It is important to look at demographic performance by product type because each of your product types may resonate better with a different audience.
2. Location
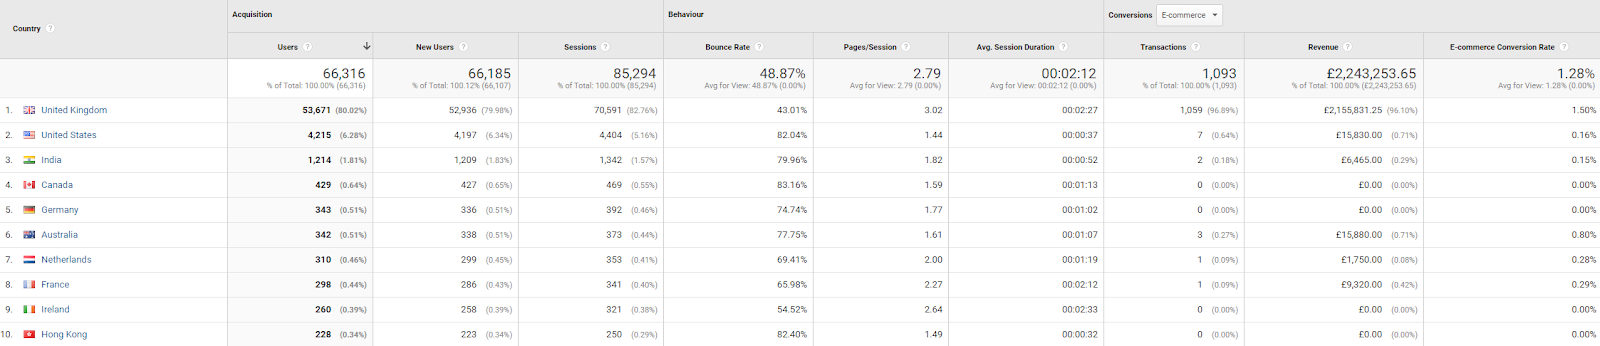
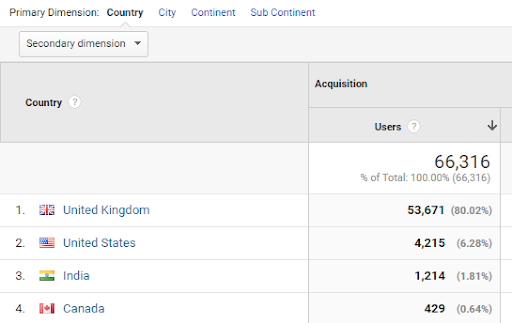
The Location report allows you to split the performance of your website by location. Here you can see your website’s performance by location including the users, new users, sessions, bounce rate, pages per session, average session duration and goal completion metrics
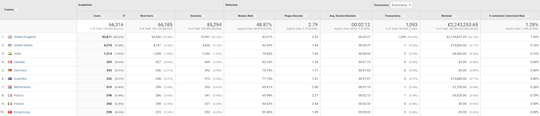
You can split the data by country, city, continent, and sub-continent. To change the location criteria, all you need to do is change the Primary Dimension settings to the location criteria that you want.
Where to find the report: Audience > Geo > Location
Example uses of the report
Determine which countries to focus your efforts on
The ability for multinational companies to have a top-level view of the performance of their website in each country can be very powerful.
You can combine transactions and revenue data with the amount of money you have invested in each country. Once you have this data, you can begin to understand which countries profitable, and which ones are require more work. This can be a good starting point to start having discussions on the strategies that were carried out in each country and how well they worked.
It may be that in one country, you don’t have a lot of sessions because your organic rankings are low, but the e-commerce conversion rate is high. In this case, you may decide to invest more money into this country to take advantage of the high conversion rate.
You may also notice that the bounce rate is particularly high in one country and therefore decide to investigate why this is. Could it be because your pricing in that country is not competitive, or your customers in that country don’t like your website? Once you have identified which countries perform poorly, you can start to diagnose why this might be.
Apply location bid adjustments on Google Ads
Some PPC advertising platforms, including Google Ads, allow advertisers to apply bid adjustments to specific locations. So, if you notice that your conversion rate is a lot better or a lot worse in a particular City, then you can apply a bid adjustment in that city to either increase or decrease the bids in that area. To help you decide on how much bid adjustment to use, look at the e-commerce conversion rate of each city. Make sure that a city has enough sessions before deciding on what bid adjustment to apply to it.
3. Search Terms
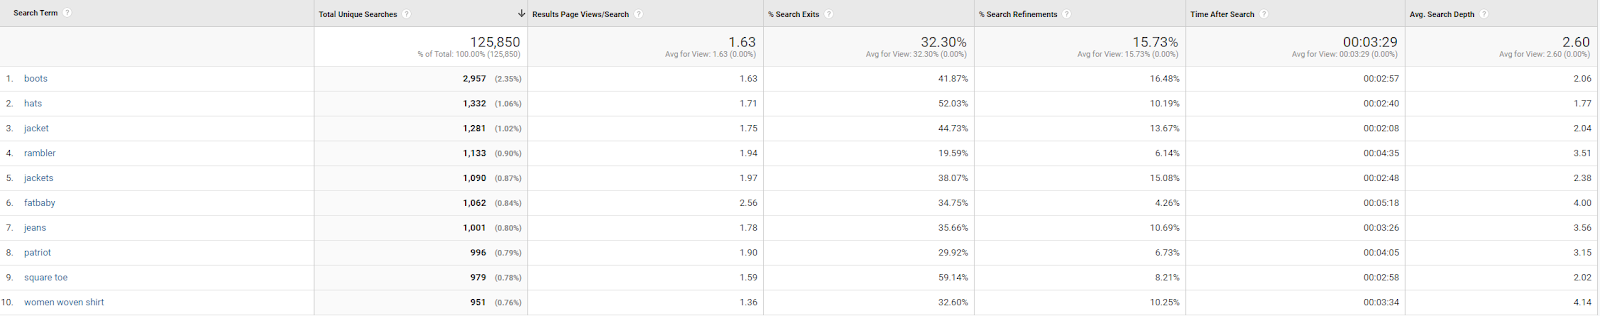
The Search Terms report shows what your website visitors searched for in your search bar. The report doesn’t contain transactions and revenue data, but it does include some metrics that can help you to improve the flow of your website.
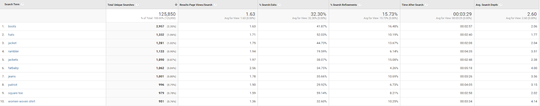
The Search Terms report contains the following metrics
- Total Unique Searches – The total number of times each person searched for something on your site
- Results Page Views/Search – The average number of times visitors viewed a search results page
- %Search Exits – The percentage of times people excited your site after performing a search
- %Search Refinements – The percentage of times that a user had to refine their search further
- Time After Search – The amount of time people spent on the site after performing a search
- Avg. Search Depth – The number of pages people visited after performing a search
Where to find the report: Behavior > Site Search > Search Terms
Setting up the Site Search reports
Unlike many of the other reports within Google Analytics, the Site Search report does need to be set up before you can start benefiting from it. This is because Google Analytics needs to know what query parameter to look for within your URL when deciding on what is a search and what is not.
To switch on Site Search reporting within Google Analytics, click on Admin at the bottom left of Google Analytics and then on View Settings. From here, switch on Site Search Tracking and add in a query parameter. The query parameter is the text that Google Analytics should look for when deciding what is a search and what is not.
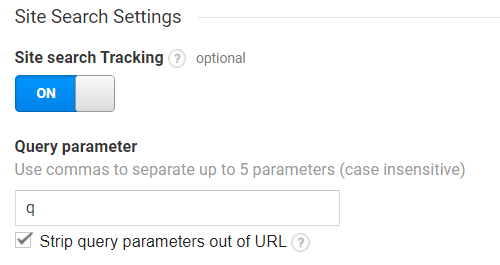
The query parameter depends on the structure of your website. If we consider the below URL structure, when a search is performed, the URL structure contains ‘?q=’. This means that all searches start with ‘?q=’. So, in this case, you would add ‘q’ as the query parameter within Google Analytics

Example uses of the report
Identify new pages to create
The Search Terms report can often surface high volume searches your target audience are looking for that you didn’t create a separate page for. For example, if you sell shoes and you notice that there a high volume for a certain brand of shoes, then you could consider creating a separate landing page for that particular brand of shoes. If this does well for you, then you may consider adding a link to this section on your homepage.
Identify how your search bar could be improved
Keep an eye on the %Search Exits metric for each search term and the landing pages being served. If you notice that a specific theme of searches has a high %Search Exit rate, then this shows that a lot of people who search for that term are not finding the answer to their query. Look at what searches get served for that search term. It may be that the best page is not being triggered for that search term, or that the page that is being served doesn’t adequately answer the user’s question. Once you have this information, you can start to improve your search bar.
Expand your product line-up
If you notice a lot of searches for a product or type of products that you don’t sell, then perhaps there is potential to expand your product portfolio and start selling those products.
4. Product Performance
The product Performance report shows sales of each individual product. Businesses will no doubt be able to see the number of sales that they’re getting for each product within their CMS. However, what makes the product performance report powerful is the ability to match up product sales with other data that Google Analytics has. The ability to add in extra dimensions using the Secondary Dimensions tab allows e-commerce businesses to open a lot of product performance analysis capabilities.
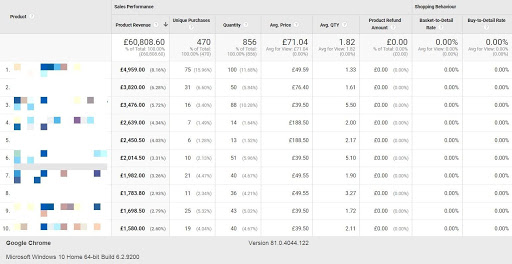
Where to find the report: Conversions > E-commerce > Product Performance
Example uses of the report
See which channel is producing sales of each product
It can be useful to see if there is a particular channel that is producing most of your sales for a particular product. Once you have this information, you can start to see what type of products sell well on each channel. You can use this information to help you to decide what areas to optimise on for each channel. You can look at the performance of each channel by adding ‘source/medium’ as a secondary dimension.
See what PPC keywords produce sales of each product
The product performance report allows Google Ads PPC keywords to be added as a secondary dimension. You can use this information to see if there are any types of keywords that result in the sale of a specific product. For example, what products tend to sell well for keywords that contain ‘cheap’? You can use this information to decide on what products to push on the landing page for each group of products. If you notice that a specific set of keywords result in the sale of any particular set of products, then you could decide to create another landing page that only contains those products. To look at product performance by keyword, add in ‘Keyword’ as a secondary dimension.
See which PPC search queries produce sales of each product
Similar to adding in ‘Keyword’ as a secondary dimension, you can also add in ‘Search Query’ as a secondary dimension. You can use your search query data in a similar way to using your keyword data. However, with search queries, you can get a lot more granular with the insights that you get. This is because your search query data is likely to show much longer tail searches. The only caveat would be that you may not have enough data when looking at search query level data.
5. Page Timings
Having a fast website is an essential factor to consider when looking for areas to improve your website. Site speed is one of Google’s ranking factors. That means that by improving your website speed, you are likely to see an increase in your organic rankings. What’s more, a faster website is likely to have a higher conversion rate. According to Google research, a one-second delay in mobile load times can impact your mobile conversions by up to 20%. Forty-seven per cent of consumers expect a web page to load in two seconds or less.
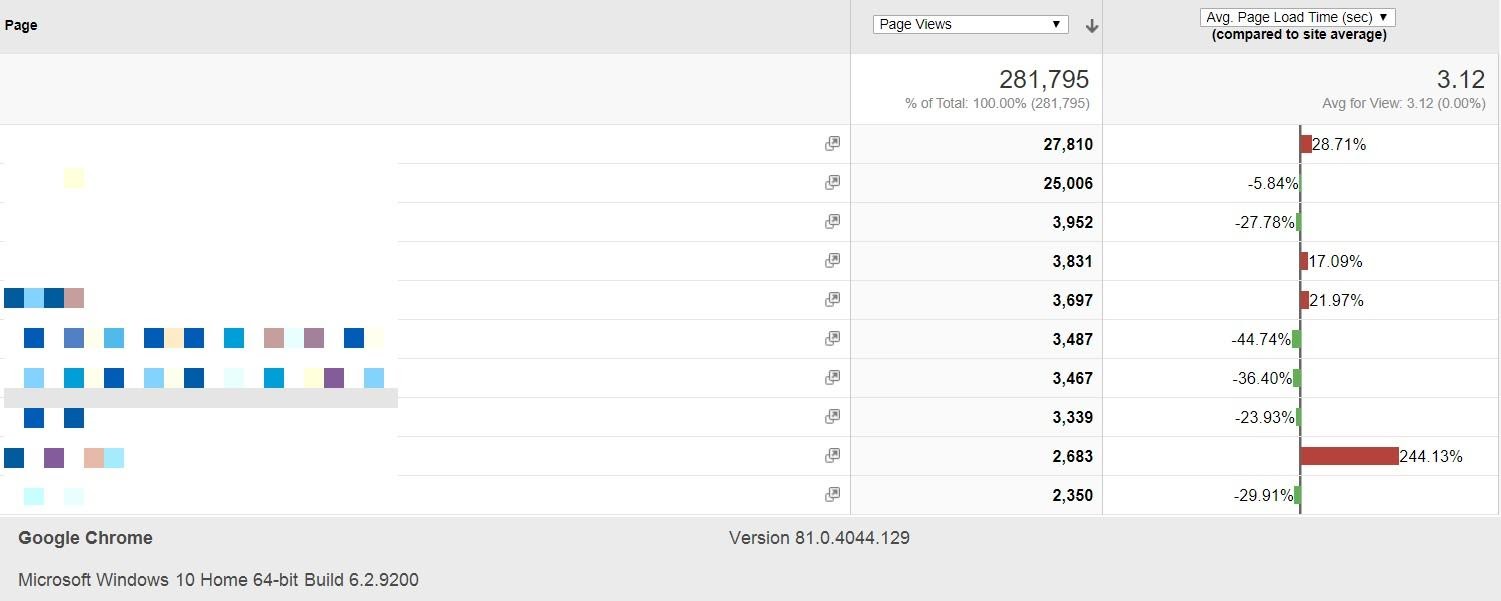
A useful report when looking at optimizing your website’s speed is the Page Timings report. It allows you to look at the average page load time in seconds of each of your pages. When you load the report, it will show you the number of page views and the average page load time in seconds for each page on your website. The Page Timings report is a good starting point when looking at what areas of your site are loading slowly.
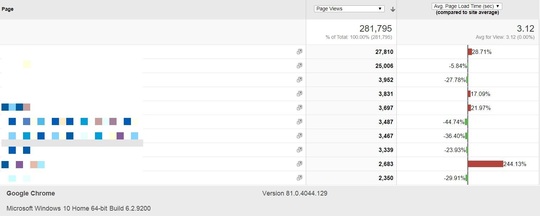
Where to find it: Behavior > Site Speed > Page Timings
Example uses of the report
Identify pages that have a slower than average page load time
The primary use of the Page Timings report is to show you which pages are loading slower than the average load time of your site. Once you have this information, you can take a look at the contents of the specific page to diagnose what the problem could be. If there is some poorly written code or code that is no longer being used, then you can start to think about rectifying this problem.
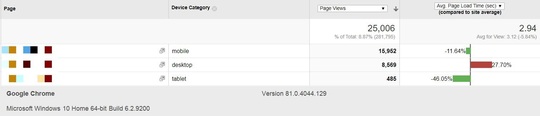
Find out which device is causing the slower page load time
Once you have identified the page that you want to look at speeding up, you can ‘Device Category’ as a secondary dimension. This will show you which device performing the worst on the landing page that you’re looking to optimise. If there is a particular device that performs poorly, then you know which device to focus your efforts on.
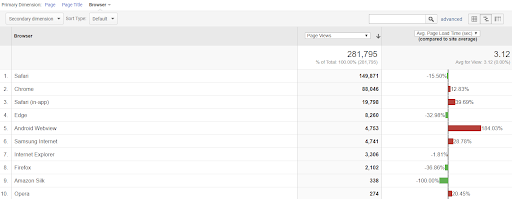
Compare page load time based on the user’s browser
The Page Timings report allows you to change the Primary Dimension from looking at the average load time of a page to the average load time of your site on each browser. This is useful because you can check to see if there is a particular browser that performs much worse than the other browsers. If you find that your website loads much slower on one browser than on another browser, then you can start to look into why this could be.
6. Wrapping up
Google Analytics has an incredible amount of data on how people interact with your website. If you’re using Google Analytics just to track the number of visitors you’re receiving from each channel, then you’re not making full use of the data on your screen. The five reports that I have outlined above are a good starting point for e-commerce businesses looking to get more detailed insights from their Google Analytics data. Start digging deeper into your Google Analytics reports and see what insights about your e-commerce business you can uncover.
This guest article was written by Rashed Khan, PPC Director at UK-based PPC agency Pepper PPC Agency. He has been helping businesses with their PPC marketing for over six years. Rashed is interested in digital marketing practices in general as well as all things Google. Learn more about Rashed by visiting his personal PPC consulting site.